LANDSCAPE ARCHITECTURE CONTRIBUTES TO ECONOMIC SUSTAINABILITY
Providing designed outdoor spaces that act as financial assets to the community
Keywords identity, revitalization, development, value
Background and Definition
CLARB Definition:
Landscape architecture contributes to economic sustainability by assisting policy makers and others to improve the marketability and long-term value of residential and commercial property. Economic benefits include reduction of crime, smart development and growth, improved air and water quality, efficient energy use, enhanced quality of life and health, and access to culture and recreation. (CLARB 2009)
Elaboration on CLARB Definition:
Landscape architecture influences economic sustainability by providing designed outdoor spaces that act as assets to the community in the following ways:
- increasing property value and rental rates
- reducing running costs for home and business owners
- reducing cost of maintenance for the city
- increase in worker productivity
- increase in a sense of identity leading to a revitalized community
- increase in retail activity and tourism
Thus, the community becomes more economically stable benefitting the overall well-being of a population. Studies have shown that proximity to green public spaces generally increase the value of a home or business by up to 15% (Crompton 2007) as well as increasing the amount of retail activity and tourism in an area (Dumpelmann 2014). Additionally, having a large amount of vegetation near your home or business reduces cooling costs during hotter months, as well as providing additional opportunities for stormwater runoff infiltration therefore reducing the amount of stress put on the drainage system of a city or town, allowing for less frequent maintenance. Studies have shown that access to plants and nature allow workers to be more productive, as well as provide the community with a sense of identity and therefore revitalize the community (projectevergreen.org 2013).
Issues/Dilemma
How do landscape architects help to increase property value of business and surrounding areas?
How do landscape architects help business and home owners become more sustainable and efficient therefor saving money and increase their profits in the long run?
Precedents
Bryant Park
Client: New York City Parks
Year of Completion: 1992
Project Location: New York City, New York, United States
Site Area: 9.6 acres
Landscape Architects: Hanna/Olin Ltd. Lynden Miller, Hardy Holzman Pfeiffer Associates
Bryant Park is a successful example of how landscapes impact economic sustainability due to the atmosphere that the space provides. Bryant Park used to be an undesirable area but with strategic planning and design the spaces now full of people and pop up business. The plantings in the park makes it feel alive and personal, while the movable seating gives people a sense of independence, the food kiosks and shops located in the park gives users a great place to eat lunch or take a break. The park also has security and safe lighting at all hours of the day. The Business Improvement District helps to keep the businesses around the park involved in events, and in return- the park users help bring in revenue for those businesses (Garvin 1997, 44-57) The total annual revenue of Bryant Park is nearly 2 million dollars. Property value in the surrounding areas increased 114% from 1992-2002, creating over one billion dollars in real estate value (Bryant Park 2015).
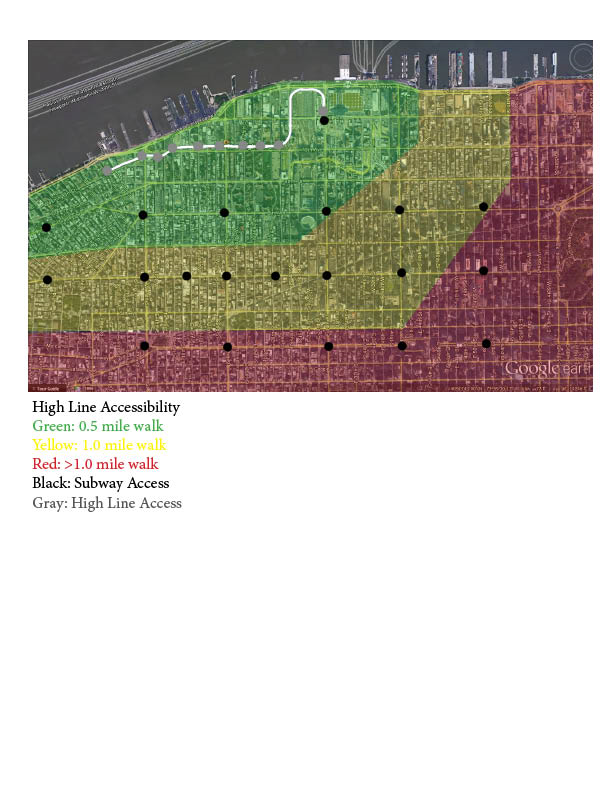 Figure 2.1: Event In Bryant Park. (Fountain 2007).
 Figure 2.2: Bryant Park at Night. (Gillespie 2013).
 Figure 2.3: Retail Kiosks In Bryant Park. (InSopphoWeTrust 2011).
 Figure 2.4: Property Values Rise. (Rose 2015).
The High Line
Client: City of New York
Year of Completion: 2014 (Final Phase)
Project Location: New York, New York, United States
Site Area: 395 acres
Landscape Architects: James Corner Field Operations, Diller Scofidio + Renfro
The High Line is an excellent example of economic sustainability relating to landscape architecture because of the revitalization of the community surrounding the site and the amount of tourism and revenue it brought to New York City. Property values near the High Line have increased by 103% between 2003 and 2007 (Crompton 2007), with many of the property values in neighborhoods such as the West Village and Chelsea steadily increasing since 2004 and remaining above the New York City average for median sale prices (West Village 2015). The High Line has sparked the development of the surrounding areas due to its approximate 3 million visitors per year, inciting around $2 billion in economic impact with 12,000 jobs, 2,500 new residential units, 1,000 new hotel rooms, and more (The Highline 2012). Many cities can learn from the success of the High Line and the impact that it has had, showing how many positive effects outdoor public spaces can have on an environment.
 Figure 2.5: Sunny Day at The High Line (Berkowitz 2009).
 Figure 2.6: Street View of Overlook. (Harris 2010).
 Figure 2.7: View of the Park. (Berkowitz 2009).
 Figure 2.8: Accessibility to the High Line . (Fiala 2015)
San Antonio River Improvements Project
Client: San Antonio River Authority Board
Year of Completion: Last phase completed in 2013
Project Location: San Antonio, Texas, United States
Site Area: Around 4,000 Acres
Landscape Architects: SWA Group and Nancy L. Fleming, ASLA
The San Antonio River Improvements Project helped stimulate economic sustainability in many different ways. Linking paths from current and future single-family homes and businesses from surrounding neighborhoods help the economy by increasing property value. Updates to current pathways along the “main corridor” provided better, more effective access to businesses. By the removal of exotic, invasive species and replacing them with native ones resulted in lowered maintenance costs. Increased parks and recreation areas were made available for users, which attracts even more people to the area helping to stimulate the economy in even more diverse ways. River water improvements helped to make a more ecologically sound environment as well as flood prevention measures that will help to prevent damage to surrounding areas in times of high water. Major project goals included: accessible pathways, many of which are to be raised up, vegetative barriers between pedestrians and the water’s edge, reestablishing river banks and reinforcing them with erosion control plantings, widening the river channel, and directing views down to the water (reference Figure 2.12). Annually the River walk brings in $1.8 billion a year for the local economy. (Nivin 2014).
 Figure 2.9: Vegetative Water Pathways. (Polywoda 2013).
 Figure 2.10: River Improvements Help Control Flooding. (Baker 2007).
 Figure 2.11: Diagram of Master Planning for River Updates (SWA Group 2015).
 Figure 2.12: Analysis of Design Improvements (Jagels 2015)
References
Garvin, Alexander, and Gayle Berens. “Bryant Park.” In Urban Parks and Open Space. Washington, D.C.: ULI, Urban Land Institute, 1997.
“Bryant Park Park History.” Bryant Park. Accessed January 30, 2015. http://www.bryantpark.org/about-us/born.html
Dümpelmann, Sonja. 2014. “An Introduction to Landscape Design and Economics.” Landscape Research 0 (0): 1–11. doi:10.1080/01426397.2014.939614.
“About the High Line | Friends of.” 2015. The High Line. Accessed February 2. http://www.thehighline.org/about.
“Council of Landscape Architectural Registration Boards”. 2009. CLARB. Accessed January 29, 2015. https://www.clarb.org/Pages/default.aspx
Crompton, John L. 2015. “Impact Of Parks & Open Spaces On Property Values.” Accessed January 28. http://www.cprs.org/membersonly/Winter07_PropertyValues.htm.
“The High Line: New York City’s Park in the Sky.” 2012. https://www.planning.org/china/presentations/2012/pdf/fisher.pdf.
“West Village, New York Average and Median Listing Prices – Trulia.com.” 2015. Accessed January 28. http://www.trulia.com/real_estate/West_Village-New_York/5269/market-trends/.
Nivin, steve, ph.d. “Impact of the San Antonio River Walk. “ 2014. Accessed. January 26. http://www.sanantoniotourism.com/downloads/research/River%20 Walk%20Impact%20Study%20Final%20-%20April%202014.pdf
Figure References
Figure 2.1 “Bryant Park.” June 25, 2007. Digital photograph by Brian Fountain. Accessed February 9, 2015. Reproduced from flickr, https://www.flickr.com/photos/bfountain/626356049/. Made available under an Attribution 2.0 Generic Creative Commons license, https://creativecommons.org /licenses/by/2.0/.
Figure 2.2 “Bryant Park Nights” 2013. Digital photograph by John Gillespie. Accessed February 20, 2015. Reproduced from flickr, https://www.flickr.com/photos/johnji/8732161413/. Made available under Attribution 2.0 Generic Creative Commons license, https://creativecommons.org/licenses/by-sa/2.0/
Figure 2.3 “Bryant Park.” October 28, 2011. Digital photograph by InSapphoWeTrust (flickr username). Accessed February 9, 2015. Reproduced from flickr, https://www.flickr.com/photos /skinnylawyer/6328539066/. Made available under a Attribution-ShareAlike 2.0 Generic license, https://creativecommons.org /licenses/by-sa/2.0/
Figure 2.4 Rose, Katelyn. 2015. Bryant Park Property Values. Source map: Google Earth. New York City, New York. 40°45’14.82”N 73°58’59.36”. Accessed 20 February 2015.
Figure 2.5: “High Line Park – New York City – July 09”. 2009. Digital photograph by David Berkowitz. Accessed January 29, 2015. Reproduced from flickr, https://www.flickr.com/photos/davidberkowitz/3692393810/. Made available under an Attribution 2.0 Generic Creative Commons license, https://creativecommons.org/licenses/by/2.0/
Figure 2.6 “The High Line NY.” 2010. Digital photograph by Nick Harris. Accessed January 29, 2015. Reproduced from flickr, https://www.flickr.com/photos/nickharris1/5002934114/. Made available under an Attribution 2.0 Generic Creative Commons license, https://creativecommons.org/licenses/by-nd/2.0/
Figure 2.7 “High Line Park NYC – Manhattan – New York City”. 2011. Digital photograph by David Berkowitz. Accessed January 29, 2015. Reproduced from flickr, https://www.flickr.com/photos/davidberkowitz/5922901497/. Made available under an Attribution 2.0 Generic Creative Commons license, https://creativecommons.org/licenses/by/2.0/
Figure 2.8 Fiala, Abigail. 2015. Accessibility to the High Line. Source map: Google Earth. New York City, New York. 48°44’52.38”N 74°00’17.17”W
Figure 2.9 “The Riverwalk, San Antonio, Texas.” 2013. Digital photograph by V.T. Polywoda (flickr username). Accessed February 20, 2015. Reproduced from flicker, https://www.flickr.com/photos/vtpoly/8673496173/. Made available under an Attribution 2.0 Generic Creative Commons license, https://creativecommons.org/licenses/by-nc-nd/2.0/
Figure 2.10 “San Antonio, Texas”. 2007. Digital photograph by Elisabeth Baker. Accessed February 20, 2015. Reproduced from flickr, https://www.flickr.com/photos/elisabethlovesuggs/2311389430/. Made available under an Attribution 2.0 Generic Creative Commons license, https://creativecommons.org/licenses/by/2.0/
Figure 2.11 “San Antonio River Improvement Project.” 2001. Digital Rendering by SWA Group. Accessed February 20, 2015. Reproduced from http://www.swagroup.com/project/san-antonio-river-improvement-project.html
Figure 2.12 Emily Jagels. 2015. Analysis of Design Improvements. Source Image: “River Walk 2013.” September 2, 2013. Digital photograph by Edward Beavers. Accessed February 22, 2015. Reproduced from flickr, https://www.flickr.com/photos/thescorpionlair/9698996289. Made available under an Attribution 2.0 Generic Creative Commons license, https://creativecommons.org/licenses/by-nc-sa/2.0/


